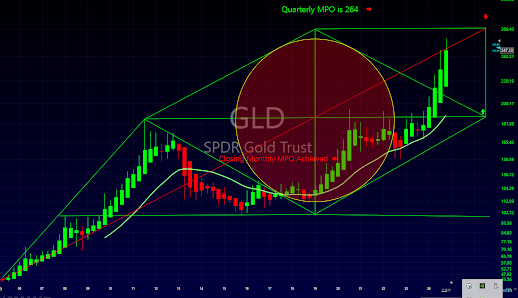
On Dec 31st 2022 with Gold at $1826, Gold Rush! - The Map to the Mother Lode was published on the Benchmark member site with a prediction of $2700 - $3000 Gold by October 2026.
At the time, TG questioned it as “Unbelievable? Some sort of quackery? Too good to be true?” Answer was, “It’s not a joke. It's not a drill. It's the main event”.
On 9/26/24 Gold futures arrived at the $2708 level, 2 years in advance!
In Benchmark's July 2024 Gold Rush update, it was noted that "If we arrive at the original goal of $2700-$3000 at least 1 year prior to 2026, the new goal is $xxxx to $xxxx (reserved for Benchmark members) by October xxxx."
GLD Results
Since the Gold has reached another round number and the GLD is at the exact red center line on the quarterly chart, a retracement of sorts is expected in the 4th quarter.
In any case, I buy all $100-$200 gold declines at support levels from the last cycle high and all new daily trends.
In Summary
These are all major achievements and am truly thankful for all the results. They were primarily beneficial to those who want to focus on a larger "paycheck" and have a longer term investment horizon.
Below demonstrates how this was done with historical chart results plus three stocks which are still low priced but in progress to their goals.Trader Garrett
Updated Nov 2024
------------------------------------------
Monthly MPO's and their results were also discussed in Part 3 of the Independence Gold Mine series.
This is primarily beneficial to those who want a larger "paycheck" and have a longer term horizon and focus.
In this context, all new daily trends are bought provided there are continuing positive weekly and monthly trends present.
The monthly context is great. What about quarterly trends?

Again, this is primarily beneficial for those who have a longer term outlook.
Here is a historical example completed in 2016


NG

- First Majestic (AG) (Achieved objective 1/28/21)
- Pretium Resources (PVG) (11/9/21 Newcrest takeover)
- Premiere Gold Mines (PG.TO) (4/7/21 Equinox Gold takeover)
- International Tower Hill (THM)
- Vista Gold (VGZ)
In Summary
Trader Garrett
8/8/20 (Takeover results updated Nov 2021)


No comments:
Post a Comment