
Trader Dan Norcini - Commodity Q&A
Question: Is the Trading Economics world food price link valid?
Answer: I have seen that same index in the past and honestly do not know how accurate it is. My guess is that even the bumbling dolts at the UN can get a couple of things correct however.
Question: What influences worldwide commodity prices?
Answer: Most of the commodity prices worldwide tend to rise and fall together since the global economy tends to see food grown in one region of the world, rise as demand shifts from a rise in price for the same commodity in another part of the world. That tends to push demand into the lower priced commodity since so much of the global economy is intertwined, causing it to rise in price as well. Same goes in reverse when prices are falling.
Question: Do have any specific examples?
Answer: Wheat is grown in so many countries around the world that its global price rises and falls together in all the countries that grow it. For example, if US wheat prices move higher, demand will shift to Australian wheat or Canadian wheat. Wheat grown in the Ukraine region will then tend to rise as demand shifts towards there. The war over there has messed with this normal response at times but generally what I described above happens pretty consistently.
Same goes with soybeans…if Brazilian beans get too high priced, demand will come back to the US and that pushes our bean prices higher.
Question: What are the best commodity indexes to follow?
Answer: The best commodity index was the old CCI that the Nymex kept up. They discontinued to it however.
Now most folks reference the Goldman Sachs Commodity Index (GSCI) or the Dow Jones/UBS commodity index. I think the latter is also the Bloomberg index but not for sure.
11/9/24
===========
Dan Norcini - Euro Gold vs US Gold
Back in the day, when I was actively writing for the gold and silver community, I used to regularly include charts of EuroGold and YenGold to show the readers how investors in the metal outside of the US are faring.
As you know, the Asian and European markets are very, very active in gold, perhaps even more than US investors (although crypto has definitely made big inroads in all countries, especially Asia). It was useful to me to look at the charts of gold in these foreign currencies to get a sense of trend.
What has always been true is that gold is the “anti-Dollar”. It is either a vote of confidence in the US economy/government fiscal condition or a vote against it. When the Dollar is weak, Gold tends to be strong. The opposite is true – when the Dollar is strong, especially if interest rates in the US are rising, gold tends to be weaker.
What does happen however is when gold shrugs off this normal relationship, in other words, moving higher even when the US Dollar is stronger, the effect on the metal when viewed in terms of foreign currencies is even more pronounced. It actually outperforms the gold price that we see here in the US.
Take a look at the chart and you can see that gold priced in Euro terms has gained 34.6% as of today’s gold price while Dollar-priced gold has increased 31.7%. Both are year to date performances.

Also, notice how the two golds performed on their respective charts. Eurogold has not broken its uptrend drawn off the March 2020 low (Covid starts) and the low formed in August the following year (2021).
Dollar-priced gold did however break the uptrend and fell through horizontal chart support drawn off the 2021 lows whereas Eurogold never even came close to even testing that important chart support level.
After consolidating over a 3-month period from April this year to July, the metal has now entered what sure appears to be an acceleration phase as the slope of the ascent line has steepened dramatically. The top of the congestion phase ( consolidation) has now become the new downside support level. The price should not close through this level – particularly in EuroGold if the uptrend remains in force. Investors who hold a long-term view of the metal will probably be looking to add on if price does drop down closer to this support region.
It would be negative for prices however if price was to fall through the bottom of the congestion zone and be unable to quickly recover. That to me would signify a change in the trend.
If you think any of this is useful to your readers, please feel free to post my thoughts and the chart up at your site buddy.
Sincere best wishes old friend,
Dan
10/21/24
===========
April 2024 Comment from Dan Norcini
"I cannot even describe to you the deep concern I have for this nation and where we are headed. If the desiccated husk that is currently in office somehow gets re-elected, it is over for our nation."
===========
Hi Garrett –
I am pretty much at the point of winding things down in my trading career. I have been at this for 30 years and truth be told Garrett, these markets have become idiotic. I have been around long enough to remember trading fundamentals and how essential it was for a successful trader to have a firm grasp on those things.
Nowadays, nothing really matters anymore. Computerized trading systems have essentially destroyed the relationship between markets and reality in my opinion. Sure, eventually real-world fundamentals will assert themselves and bring price back to where it should have been, but in the interim, funds can push prices to absurd levels which are utterly disconnected from anything real.
The problem is few traders these days have been around long enough to have participated in what I term, “normal markets”. Everything today is based on momentum – markets in that sense are like hunting dogs – “If it moves, chase it”.
It does not matter whether it is moving up or down; it gets chased and will continue to get chased until it no longer does. Then price reverses sometimes going in the opposite direction to same degree as it went in the former.
I will tell you something Garrett – as many years as I have been at this, I have made a good living, having learned a great deal, and experienced many setbacks and difficulties which ultimately made me a better trader. But if I had to start a trading career in these markets, I would not be able to succeed. They are too unpredictable, move too violently and make no sense for long periods of time.
I learned, after getting my brains beat out as a novice trader, to trade ONLY those markets that I understood and to stay away from anything that I could not wrap my mind around. That meant trading only markets in which I had a firm grasp of the fundamentals. That helped me to understand when the funds, mostly run by idiots who all think they are the best traders on the planet at all times, have pushed something to ridiculous levels. That is when I now make my moves. Other than that, you have to get out of their way or throw caution to the wind and just jump in and start chasing everything that they do – something I refuse to do.
That being said, I have lost the desire to write over the last year or so, having essentially become disgusted at what has taken place in the trading arena. Like just about everything else in our nation, the markets are dysfunctional in my opinion. Sure, there are always the inexperienced dolts who will parrot the usual tripe – “Markets are efficient and serve the function of price discovery well”. No they don’t. What they serve is the owners of the algos and the others who contribute nothing to true price discovery but who have invested huge amounts of money in their sophisticated computerized systems to be the first to get into a market and the first to get out of it after fleecing as many others as they can in the process.
I can well remember, back during the days of the open outcry markets – which were less efficient in terms of getting orders filled and prices reported bac – but were more honest and transparent, how the Commercial traders were the 800-pound gorillas on the block. If they decided to sell, that was the end of a rally. If they decided to buy, prices were not going down anymore. Nowadays, those guys regularly get run over by hedge funds and they too have had to learn to adapt their risk management practices to make allowances for the speculators who know nothing of the fundamentals and who could care less. For the latter, it is the rabbit that is moving and they are the Greyhounds who must chase it. They cannot help themselves.
I have a lot going on in my life these days and that is another reason for the lack of interest in writing. I have buried two parents, have a very sick twin brother, married off one of my daughters, and built a new house (at precisely the worst time to do so) thanks to bidenomics and soaring prices. Not to mention having to personally fix and pay for the crap my builder screwed up.
I am glad to hear that you have gotten out of Colorado and are down in Arkansas. Anywhere in the South is better than living in a blue state like Colorado has become. I am sick of the mutilation of children that these blue state Marxists have embraced along with the rest of the madness that infects them and has destroyed the ability to live there.
Here in Idaho we are doing our best to keep our freedoms and avoid becoming infected by the disease of cultural Marxism ( woke ideology). I pray that we are successful as our children will inherit the fallout and the inevitable misery that follows these doctrines from hell if not.
My sincere best wishes to you Garrett. You are becoming an increasingly rare bird in this generation. You are a man of integrity with a true sense of humility.
Thank you for allowing me to be only a brief part of your community.
Sincerely
Dan
July 2023
Related: Dealing with Losing Trades - Dan Norcini - Click here
===========
Back in the day, when I was actively writing for the gold and silver community, I used to regularly include charts of EuroGold and YenGold to show the readers how investors in the metal outside of the US are faring.
As you know, the Asian and European markets are very, very active in gold, perhaps even more than US investors (although crypto has definitely made big inroads in all countries, especially Asia). It was useful to me to look at the charts of gold in these foreign currencies to get a sense of trend.
What has always been true is that gold is the “anti-Dollar”. It is either a vote of confidence in the US economy/government fiscal condition or a vote against it. When the Dollar is weak, Gold tends to be strong. The opposite is true – when the Dollar is strong, especially if interest rates in the US are rising, gold tends to be weaker.
What does happen however is when gold shrugs off this normal relationship, in other words, moving higher even when the US Dollar is stronger, the effect on the metal when viewed in terms of foreign currencies is even more pronounced. It actually outperforms the gold price that we see here in the US.
Take a look at the chart and you can see that gold priced in Euro terms has gained 34.6% as of today’s gold price while Dollar-priced gold has increased 31.7%. Both are year to date performances.

Also, notice how the two golds performed on their respective charts. Eurogold has not broken its uptrend drawn off the March 2020 low (Covid starts) and the low formed in August the following year (2021).
Dollar-priced gold did however break the uptrend and fell through horizontal chart support drawn off the 2021 lows whereas Eurogold never even came close to even testing that important chart support level.
After consolidating over a 3-month period from April this year to July, the metal has now entered what sure appears to be an acceleration phase as the slope of the ascent line has steepened dramatically. The top of the congestion phase ( consolidation) has now become the new downside support level. The price should not close through this level – particularly in EuroGold if the uptrend remains in force. Investors who hold a long-term view of the metal will probably be looking to add on if price does drop down closer to this support region.
It would be negative for prices however if price was to fall through the bottom of the congestion zone and be unable to quickly recover. That to me would signify a change in the trend.
If you think any of this is useful to your readers, please feel free to post my thoughts and the chart up at your site buddy.
Sincere best wishes old friend,
Dan
10/21/24
===========
April 2024 Comment from Dan Norcini
"I cannot even describe to you the deep concern I have for this nation and where we are headed. If the desiccated husk that is currently in office somehow gets re-elected, it is over for our nation."
===========
Hi Garrett –
I am pretty much at the point of winding things down in my trading career. I have been at this for 30 years and truth be told Garrett, these markets have become idiotic. I have been around long enough to remember trading fundamentals and how essential it was for a successful trader to have a firm grasp on those things.
Nowadays, nothing really matters anymore. Computerized trading systems have essentially destroyed the relationship between markets and reality in my opinion. Sure, eventually real-world fundamentals will assert themselves and bring price back to where it should have been, but in the interim, funds can push prices to absurd levels which are utterly disconnected from anything real.
The problem is few traders these days have been around long enough to have participated in what I term, “normal markets”. Everything today is based on momentum – markets in that sense are like hunting dogs – “If it moves, chase it”.
It does not matter whether it is moving up or down; it gets chased and will continue to get chased until it no longer does. Then price reverses sometimes going in the opposite direction to same degree as it went in the former.
I will tell you something Garrett – as many years as I have been at this, I have made a good living, having learned a great deal, and experienced many setbacks and difficulties which ultimately made me a better trader. But if I had to start a trading career in these markets, I would not be able to succeed. They are too unpredictable, move too violently and make no sense for long periods of time.
I learned, after getting my brains beat out as a novice trader, to trade ONLY those markets that I understood and to stay away from anything that I could not wrap my mind around. That meant trading only markets in which I had a firm grasp of the fundamentals. That helped me to understand when the funds, mostly run by idiots who all think they are the best traders on the planet at all times, have pushed something to ridiculous levels. That is when I now make my moves. Other than that, you have to get out of their way or throw caution to the wind and just jump in and start chasing everything that they do – something I refuse to do.
That being said, I have lost the desire to write over the last year or so, having essentially become disgusted at what has taken place in the trading arena. Like just about everything else in our nation, the markets are dysfunctional in my opinion. Sure, there are always the inexperienced dolts who will parrot the usual tripe – “Markets are efficient and serve the function of price discovery well”. No they don’t. What they serve is the owners of the algos and the others who contribute nothing to true price discovery but who have invested huge amounts of money in their sophisticated computerized systems to be the first to get into a market and the first to get out of it after fleecing as many others as they can in the process.
I can well remember, back during the days of the open outcry markets – which were less efficient in terms of getting orders filled and prices reported bac – but were more honest and transparent, how the Commercial traders were the 800-pound gorillas on the block. If they decided to sell, that was the end of a rally. If they decided to buy, prices were not going down anymore. Nowadays, those guys regularly get run over by hedge funds and they too have had to learn to adapt their risk management practices to make allowances for the speculators who know nothing of the fundamentals and who could care less. For the latter, it is the rabbit that is moving and they are the Greyhounds who must chase it. They cannot help themselves.
I have a lot going on in my life these days and that is another reason for the lack of interest in writing. I have buried two parents, have a very sick twin brother, married off one of my daughters, and built a new house (at precisely the worst time to do so) thanks to bidenomics and soaring prices. Not to mention having to personally fix and pay for the crap my builder screwed up.
I am glad to hear that you have gotten out of Colorado and are down in Arkansas. Anywhere in the South is better than living in a blue state like Colorado has become. I am sick of the mutilation of children that these blue state Marxists have embraced along with the rest of the madness that infects them and has destroyed the ability to live there.
Here in Idaho we are doing our best to keep our freedoms and avoid becoming infected by the disease of cultural Marxism ( woke ideology). I pray that we are successful as our children will inherit the fallout and the inevitable misery that follows these doctrines from hell if not.
My sincere best wishes to you Garrett. You are becoming an increasingly rare bird in this generation. You are a man of integrity with a true sense of humility.
Thank you for allowing me to be only a brief part of your community.
Sincerely
Dan
July 2023
Related: Dealing with Losing Trades - Dan Norcini - Click here
Top Secret Bullion, Brilliance & Beehives
Trader Dan Norcini, an avid beekeeper is building a new home in Idaho so there will be some delay in receiving his market presentations. Yesterday, he thanked us for our patience.
In the meantime, you will see Dan's gold investment activities buried in this complete report here...
Enjoy...
Trader Dan Norcini, an avid beekeeper is building a new home in Idaho so there will be some delay in receiving his market presentations. Yesterday, he thanked us for our patience.
In the meantime, you will see Dan's gold investment activities buried in this complete report here...
Enjoy...
===========
Dan Norcini's Email Update
Hi Garrett – I have to
apologize for being unable to produce much of anything these days… I have had
good intentions but not enough time, or energy, to write anything.
The house build is
taking pretty much all of my spare time right now.. I was a professional
landscaper before I got into trading full time and I am in the process of
trying to get that knocked out before the weather turns to crap up here… looks
like I am too late to be honest as we are going to head downhill pretty quickly
now.
Anyway, between
contractors who do not show up when they are supposed to, price hikes,
shortages ( out of stock stuff that we ordered), it is pretty much all I can
handle right now.
I know your readers
were looking forward to hearing from me (as well as your good stuff) but I am
pretty drained out at the moment.
I have been trying to
trade but have been forced to leave during the trading session quite a bit but
I am keeping track of things however.
The big thing for me
is the bond markets…. The rising yield environment is going to cause – and
already is severely impacting real estate - a rude awakening for those who have
gotten used to cheap money since early 2009 when they started the first tranche
of QE…
I will try to get
something worth your great readers buddy…
My sincere best and my
sincere apologies….
Dan
10/24/22
=============
The house build is taking pretty much all of my spare time right now.. I was a professional landscaper before I got into trading full time and I am in the process of trying to get that knocked out before the weather turns to crap up here… looks like I am too late to be honest as we are going to head downhill pretty quickly now.
Anyway, between contractors who do not show up when they are supposed to, price hikes, shortages ( out of stock stuff that we ordered), it is pretty much all I can handle right now.
I know your readers were looking forward to hearing from me (as well as your good stuff) but I am pretty drained out at the moment.
I have been trying to trade but have been forced to leave during the trading session quite a bit but I am keeping track of things however.
The big thing for me is the bond markets…. The rising yield environment is going to cause – and already is severely impacting real estate - a rude awakening for those who have gotten used to cheap money since early 2009 when they started the first tranche of QE…
I will try to get something worth your great readers buddy…
My sincere best and my sincere apologies….
Dan
10/24/22
=============
Yield Curve Continues to Invert Further
It is no secret to anyone who has been attempting to trade in these convoluted markets of late, that they are showing very little in the way of consistent price action. The sharp reversals, both up and down, are indicative of a lack of conviction on the part of both traders and investors. Simply put – very few have any sense of certainty as to where things are heading.
There was some thinking that the most recent 75 basis point rate hike by the Fed was going to be the last of such an aggressive move with more gradual interest rate hikes to become the norm in the Fed’s fight against the inflation monster. Today’s payrolls number flipped that sentiment upside down as it came in much stronger than expected.
In short, there is nothing on the table at this time to indicate that the Fed is going to suddenly become dovish. The payrolls data fired up the US Dollar on the crosses as the bond markets saw a violent selloff pushing yields back up again on the longer end of the curve in particular.
I admit that it is not at all easy to see where things are heading – there are simply too many unknowns and concerns about policy in this nation to put anyone at ease. One thing to keep an eye on however is the yield curve. It has a pretty doggone good track record of forecasting or at least, reflecting, where investors think economic activity is headed.
I use the spread between the 10-year Treasury and the 2-year Treasury as a sort of proxy for the entire curve. Here is a graph of that spread.

The thing to keep in mind when viewing this spread is its simplicity. When the line is moving higher, the spread is widening out or “steepening”. When the line is falling lower as it currently is, the spread is narrowing or flattening. (The scale on the LEFT side of the graph is the spread).
Generally speaking – and this is “generally” since there are exceptions – a steepening curve is indicative of positive economic sentiment (good growth). On the flip side – a flattening curve is indicative of negative economic sentiment (growth is slowing or actually contracting).
You can see from the graph that since the Spring of 2021, the expectation has been economic growth was going to contract. While the Fed was continuing its bond buying program and providing liquidity for the markets, the clueless Biden administration was pursuing policies that guaranteed the economy was going to slow.
Once the Fed made it very clear that they were not only going to halt the bond buying program, but actually begin to shrink the massive size of their balance sheet, that was pretty much it for the party. The monthly rate hikes that they telegraphed to get inflation under control, were just additional fodder for a rapid drop in sentiment among investors. That in turn has now seen the curve invert.
The Meaning of Inversion
By “invert”, I mean to say that the shorter-dated 2-year Treasury is now paying a higher rate of interest than the longer-dated 10-year Treasury. Again, another general rule – holders of bonds want to be reimbursed for the longer exposure they have to risk since the future gets blurry compared to what can be reasonably assumed from short-term influences and factors. That translates into sellers of bonds (in this case the US government) being forced to pay a HIGHER yield to buyers of longer-dated notes/bonds than shorter-dated bills and notes. When we do witness an inversion in the curve, where the shorter-dated debt is currently paying a higher yield than the longer-dated debt instruments, it is telegraphing that the economy is going to slow down or actually contract depending on the severity of the inversion in the curve.
Another way of looking at this and translating its meaning is to assume that the tightening of monetary policy along with a shrinking of the Fed balance sheet is going to work when it comes to reducing inflation. It will do so by slowing down economic growth dramatically. As growth slows, demand drops and with it, prices for both goods and services. Short-term however, the price of both goods and services remains high and that is telling investors to demand higher yields for debt instruments that are shorter-dated.
Conclusion
Based on this fact and the above chart, I see nothing in the curve to indicate that recent rallies in US stocks are anything more than rallies in a larger bear market. If and when the curve begins to steepen and is consistently moving in that direction, then I will put more credence in rallies in equities.
I apologize for the lack of articles of late…my schedule has been overwhelmingly busy…I do hope to get some spare time soon…
Dan Norcini
8/5/22
===========================
Current Analysis - Nasdaq

From the chart we can learn whether or not sentiment towards a particular asset is bullish or bearish. This is critical to know because it is SENTIMENT that moves the market. Whether or not one agrees with the direction of price movement is irrelevant. What matters to the trader is being on the correct side of the trend, not being married to a particular side of the market ( Bull or Bear). The trading arena is littered with the proverbial corpses of those who refused to accept what the price chart was telling them but remained stubbornly glued to either the long side or the short side.
With this in mind, let’s take a look at the weekly chart of the Nasdaq futures. I am using this intermediate term view to establish a longer-term look before moving to a shorter term daily chart.

Please notice that I am using three separate moving averages in combination with a volume chart and the graph of my favorite technical indicator, the ADX/DMI. I have also drawn in some downside support levels.
Let’s start with the moving averages. Notice that both the 10-week and the 50-week have turned lower. As a matter of fact, this is the first time since early 2020 that the 50-week has turned lower. Back then it was only for a brief period before it turned right back up again. With both the 10-week and the 50-week moving averages moving downward, the intermediate term trend is DOWN.
The longer term 200-week moving average remains moving upwards although it is flattening out somewhat. Long term this is still a market that is moving higher. Investors can use this long term moving average as points at which to begin scale down buying for stocks that they want to own for the long term portfolio. Investing is NOT THE SAME AS TRADING however.
Also, If you refer to the ADX indicator at the lower graph, the ADX line (midnight blue) is steadily rising and is currently above the 30 level. That level typically denotes a market that is in a trending move. As you can see by looking back on the chart, in June 2020, the ADX began a powerful move higher with a brief hiccup in October of that same year before soaring to nearly 50. Markets that have a rising ADX are trending; markets moving sideways or consolidating after big moves up or down have a falling ADX.
Also, on that same indicator, note that the -DMI ( Negative Directional movement index – RED) is trending upwards as price falls. This shows that the bears are in control of this market. The +DMI (Positive directional Movement Index – BLUE) is falling. Also note that it is currently making new lows. This tells us that downside momentum is quite strong at the moment.
The next thing I want to call your attention to is the Volume graph. Please note that the volume during the big selloff in early 2020 (tied to Covid lockdowns beginning) was enormous. While volume during the intense selloff that began in April of this year has been large, it remains far below that of the early lockdown stage. From what I can see of this alone, this tells me that the so-called “capitulation selling” that many are hoping for to show a definitive bottom is in the market, has not yet occurred.
Here is the same chart again. Note the horizontal support levels shown.
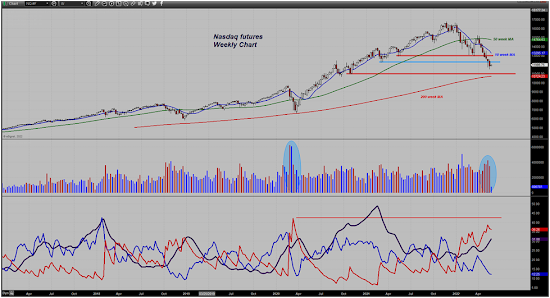
The lows made in both March of 2021 and May of 2021, have failed to stem the selling. The next level that might offer some buying support remains down near the late October 2020 lows. Those lows are quite close to the 200-week moving average which might catch the attention of technical chart traders and serve to reinforce the support region.
Based on this chart, the intermediate term trend in the Nasdaq is firmly lower. While short covering bounces can occur at any time and can be quite ferocious in intensity, the sentiment has shifted from one of “Buying Dips” to one of “Selling Rallies”. I would need to see a WEEKLY CLOSE above the falling 10-week moving average to convince me that a shorter term bottom is in this market. As long as the +DMI Remains below the -DMI, the advantage still remains with the bears.
The one thing that has driven the stock markets higher has been the TRILLIONS in liquidity provided by the Fed through its monthly bond purchases. The Balance sheet of the Fed is currently just shy of $9 TRILLION! Keep in mind that it had reached nearly $4.25 TRILLION when QE 4 ended back in 2012-2015. Since that time is has MORE THAN DOUBLED!!! It is my opinion that the entire rally in stocks since then can be attributed to this ocean of liquidity supplied by the Fed.
Here is the problem – now that the Fed is talking about reducing their balance sheet, that same liquidity is going to be removed from the markets and the economy in general. What, pray tell, is going to be the catalyst that is going to come along that will drive stocks into new highs? We have a double whammy of rising interest rates and a withdrawal of liquidity about to occur simultaneously.
Here is a chart of just the Treasury holdings currently on the Fed’s Balance Sheet. Yes, you are seeing this correctly – The Fed still owns over $5.7 trillion in Treasuries alone. This does not take into account their holdings of Federal Agency Debt nor Mortgage Backed Securities debt.

Now perhaps the Fed might survey the carnage in the stock markets and may cave in to political pressure to stop the balance sheet reduction plans. That depends on whether or not they want to keep their reputation for being impartial and independent of political pressure. That however is something that I am not personally convinced of. No one in the Fed wants to bear the blame of causing a collapse in the stock market and hurling the US economy into a severe recession or even worse. Yet, one wonders how they are going to get inflation under control with doing exactly that!
Rising interest rates will not solve supply disruptions tied to lockdown hangovers and tight employment. It seems to me that the only way to get that under control is to kill off demand and the only way to kill of demand is to make economic conditions so uncomfortable that spending falls off dramatically. Yet, that means a recession is needed. So what is the Fed going to do?
This is the reason for the angst among market participants at this time. Investors and traders are sorting all this out and are trying to figure out what the Fed may or may not do. The various Fed governors and Powell are all talking tough on inflation but do they really want to go down in history as moving too hard and too fast and causing a collapse?
Time will tell but in the interim while we wait to see how this all plays out, know that the Nasdaq is in the thralls of a bear market and desperately needs some sort of bullish input to develop. But where is that going to come from????
Dan Norcini
===========================
May 2022
The Return of Trader Dan Norcini
 Today we are very honored and delighted to have my old friend, Trader Dan Norcini contribute his insights and analysis for our website.
 Most of our readers will recognize him for his standing and stature in the commodity and precious metals area over many years and he has always been very widely followed.
We certainly appreciate his trust and confidence!
To have the opportunity of adding his periodic views and expertise, particularly in commodities, currency, bond and general markets, is a wonderful addition to this website's menu.
Be on the lookout for his presentations and commentary. His first presentation is here.
Incidentally, in the website Library, his timeless and valuable article on "Dealing with Losing Trades" is linked to mine here.
Thank you Dan and welcome!
Trader Dan's Bio

Dan Norcini is a professional off-the-floor commodities trader bringing more than 25 years experience in the markets to provide a trader's insight and commentary on the days price action. His editorial contributions and supporting technical analysis charts cover a broad range of tradable entities including the precious metals and foreign exchange markets as well as the broader commodity world. He is a frequent contributor to both Reuters and Dow Jones as a market analyst for the livestock sector and can be on occasion be found as a source in the Wall Street Journal's commodities section as well as CBS Marketwatch where his views on the gold market can often be found. He is also an avid beekeeper.

Most of our readers will recognize him for his standing and stature in the commodity and precious metals area over many years and he has always been very widely followed.
We certainly appreciate his trust and confidence!
To have the opportunity of adding his periodic views and expertise, particularly in commodities, currency, bond and general markets, is a wonderful addition to this website's menu.
Be on the lookout for his presentations and commentary. His first presentation is here.
Incidentally, in the website Library, his timeless and valuable article on "Dealing with Losing Trades" is linked to mine here.
Thank you Dan and welcome!
Trader Dan's Bio

Dan Norcini is a professional off-the-floor commodities trader bringing more than 25 years experience in the markets to provide a trader's insight and commentary on the days price action. His editorial contributions and supporting technical analysis charts cover a broad range of tradable entities including the precious metals and foreign exchange markets as well as the broader commodity world. He is a frequent contributor to both Reuters and Dow Jones as a market analyst for the livestock sector and can be on occasion be found as a source in the Wall Street Journal's commodities section as well as CBS Marketwatch where his views on the gold market can often be found. He is also an avid beekeeper.
Love it! Thanks for joining us Dan. I can see that you are just as passionate as you were when you had your own free blog. I look forward to more commentary, and thanks for this timely contribution. Wolf
ReplyDeleteDan, along with Wolf, thanks for coming aboard. Your old site, Trader Dan's Market Views is how I found The Market Pendulum.
ReplyDelete"We have a double whammy of rising interest rates and a withdrawal of liquidity about to occur simultaneously." The Fed really backed themselves into a corner on this one. And it's we the citizens that will take the brunt of it either way.
great insight. thanks
ReplyDelete